Dated reference desk · source releases retained as labelled
Numbers with their labels attached.
Production, quality, crushing, oil, meal, exports, and stocks belong to different periods and data systems. This dashboard keeps the date, status, definition, and source beside every measure.
The records below retain earlier source periods and outlooks. They are not a live feed or a refresh of those statistics. Check the linked primary publication for the latest release before using a number in a current decision.
Filter the desk
What do you need to understand?
CropFinal estimate
21.8 Mt
2025 canola production
2025 calendar crop · Released Dec. 4, 2025
What it measures
Harvested canola production reported through the November Field Crop Survey. Statistics Canada notes that final estimates remain subject to revision for two years.
Read it carefully
National yield was reported at 44.7 bu/ac. Production combines harvested area and yield; it is not the same measure as supply.
Area Canadian producers reported planting to canola in the June Field Crop Survey.
Read it carefully
This supersedes the March intentions estimate. Planted area is not harvested area and does not determine final production without yield and abandonment information.
Canola seed crushed by reporting Canadian oilseed processors during the calendar month.
Read it carefully
A monthly flow should not be read as annual capacity or crop-year crush. Compare like periods and account for the number of days and reporting revisions.
Canola meal produced by reporting processors during the calendar month.
Read it carefully
Meal is a major co-product. Its reported weight should not be added to oil and compared with seed input without reconciling moisture and reporting bases.
AAFC forecast of total canola seed exports for the August 2025 to July 2026 crop year.
Read it carefully
This is not the current cumulative observed total. AAFC reported that export movement had reached a crop-year high in May and revised the full-year forecast upward.
End-of-crop-year forecast · AAFC outlook June 19, 2026
What it measures
AAFC forecast of canola stocks remaining at the end of the 2026–27 crop year.
Read it carefully
Carry-out changes as production, imports, exports, crush, domestic use, and revisions change. It is a balance-sheet residual, not one surveyed pile of grain.
Read the date, unit and definition before the canola number
Distinguish crop estimates, monthly processing, stocks, quality samples and forecasts before comparing agricultural statistics.
Original editorial guide · October 24, 2026
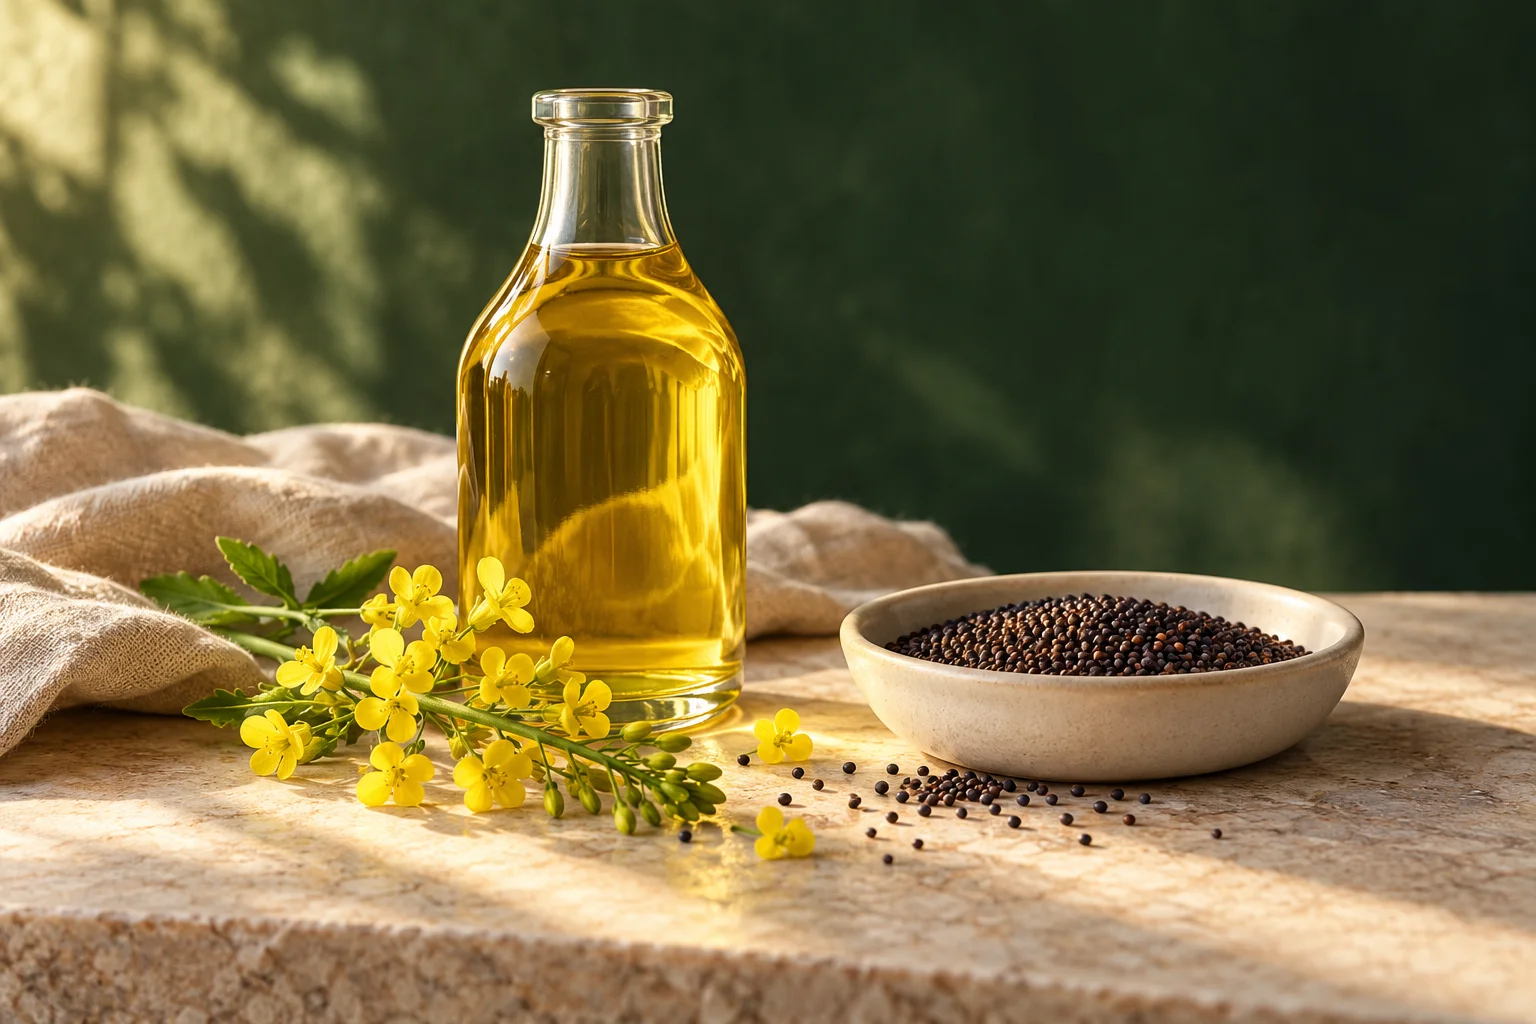
Original editorial illustration; no product endorsement or recipe test depicted.
A number needs a complete label
A canola statistic becomes useful when it carries its geography, unit, reference period, publication date and meaning. A national figure in tonnes answers a different question from a provincial area in acres or an oil-content percentage in harvest samples. Start with those labels before deciding whether a number is large, small or changing.
Use a simple reading line: what was measured, where, for which period, by whom and under which definition? If you cannot complete it, keep the number as a lead to investigate rather than repeating it as a complete fact.
Separate the crop from the reporting cycle
Statistics Canada's crop reporting distinguishes seeding intentions, seeded area, harvested area, yield, production and stocks. These describe different things at different stages of the season. An intention to plant is not a final harvest result; production cannot be understood by looking at acreage alone.
Keep the reference period separate from the release date. A report published this month may describe an earlier month or season. When comparing two releases, check whether you are seeing a revised estimate for the same period or a new observation for a different period.
Keep monthly processing and stocks distinct
The Monthly Crushing Operations Survey collects quantities of oilseeds processed, oil and meal produced, and stocks at the end of the month. Processing during a month is a flow. Stock at a particular date is an amount held at that moment. Adding them together without a defined accounting framework produces a number with little meaning.
A monthly processing observation is also different from a plant's stated capacity. Before drawing a conclusion, compare like periods, read the survey coverage and look for revisions. A percentage calculated from mismatched measures can be precise-looking and still answer the wrong question.
Ask what a quality sample represents
Harvest-quality reports describe samples and analytical methods. The Canadian Grain Commission's programme is voluntary, and its report explains how samples are combined and how measurements are expressed. A sample mean is not a guarantee for every seed lot, and seed oil content is not a promise about the recovery achieved by a particular processor.
Read the basis attached to a percentage. Moisture basis, grade, geography and sampling details affect what can be compared. Keep those details with the chart rather than moving them into a note so distant that the headline appears to make a broader claim.
Make a comparison that survives checking
Before publishing a change, line up the same commodity, geography, unit, period and definition. Save the source link and the release or retrieval date. If a method or category changed, explain the break instead of drawing one continuous trend line through incompatible observations.
Forecasts should retain their forecast label, and older observations should retain their date. A reliable dashboard can show an older number honestly when it explains its scope. Its value comes from helping readers understand the evidence, not from calling every card live or implying that a refreshed page timestamp means the underlying data were updated.